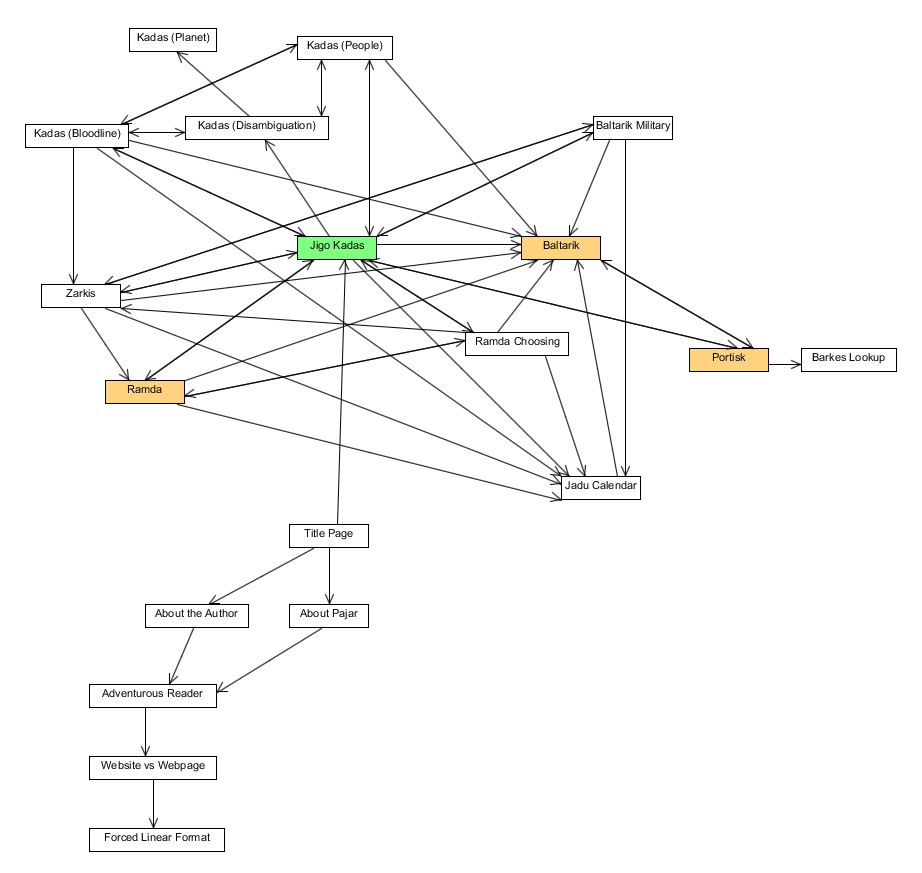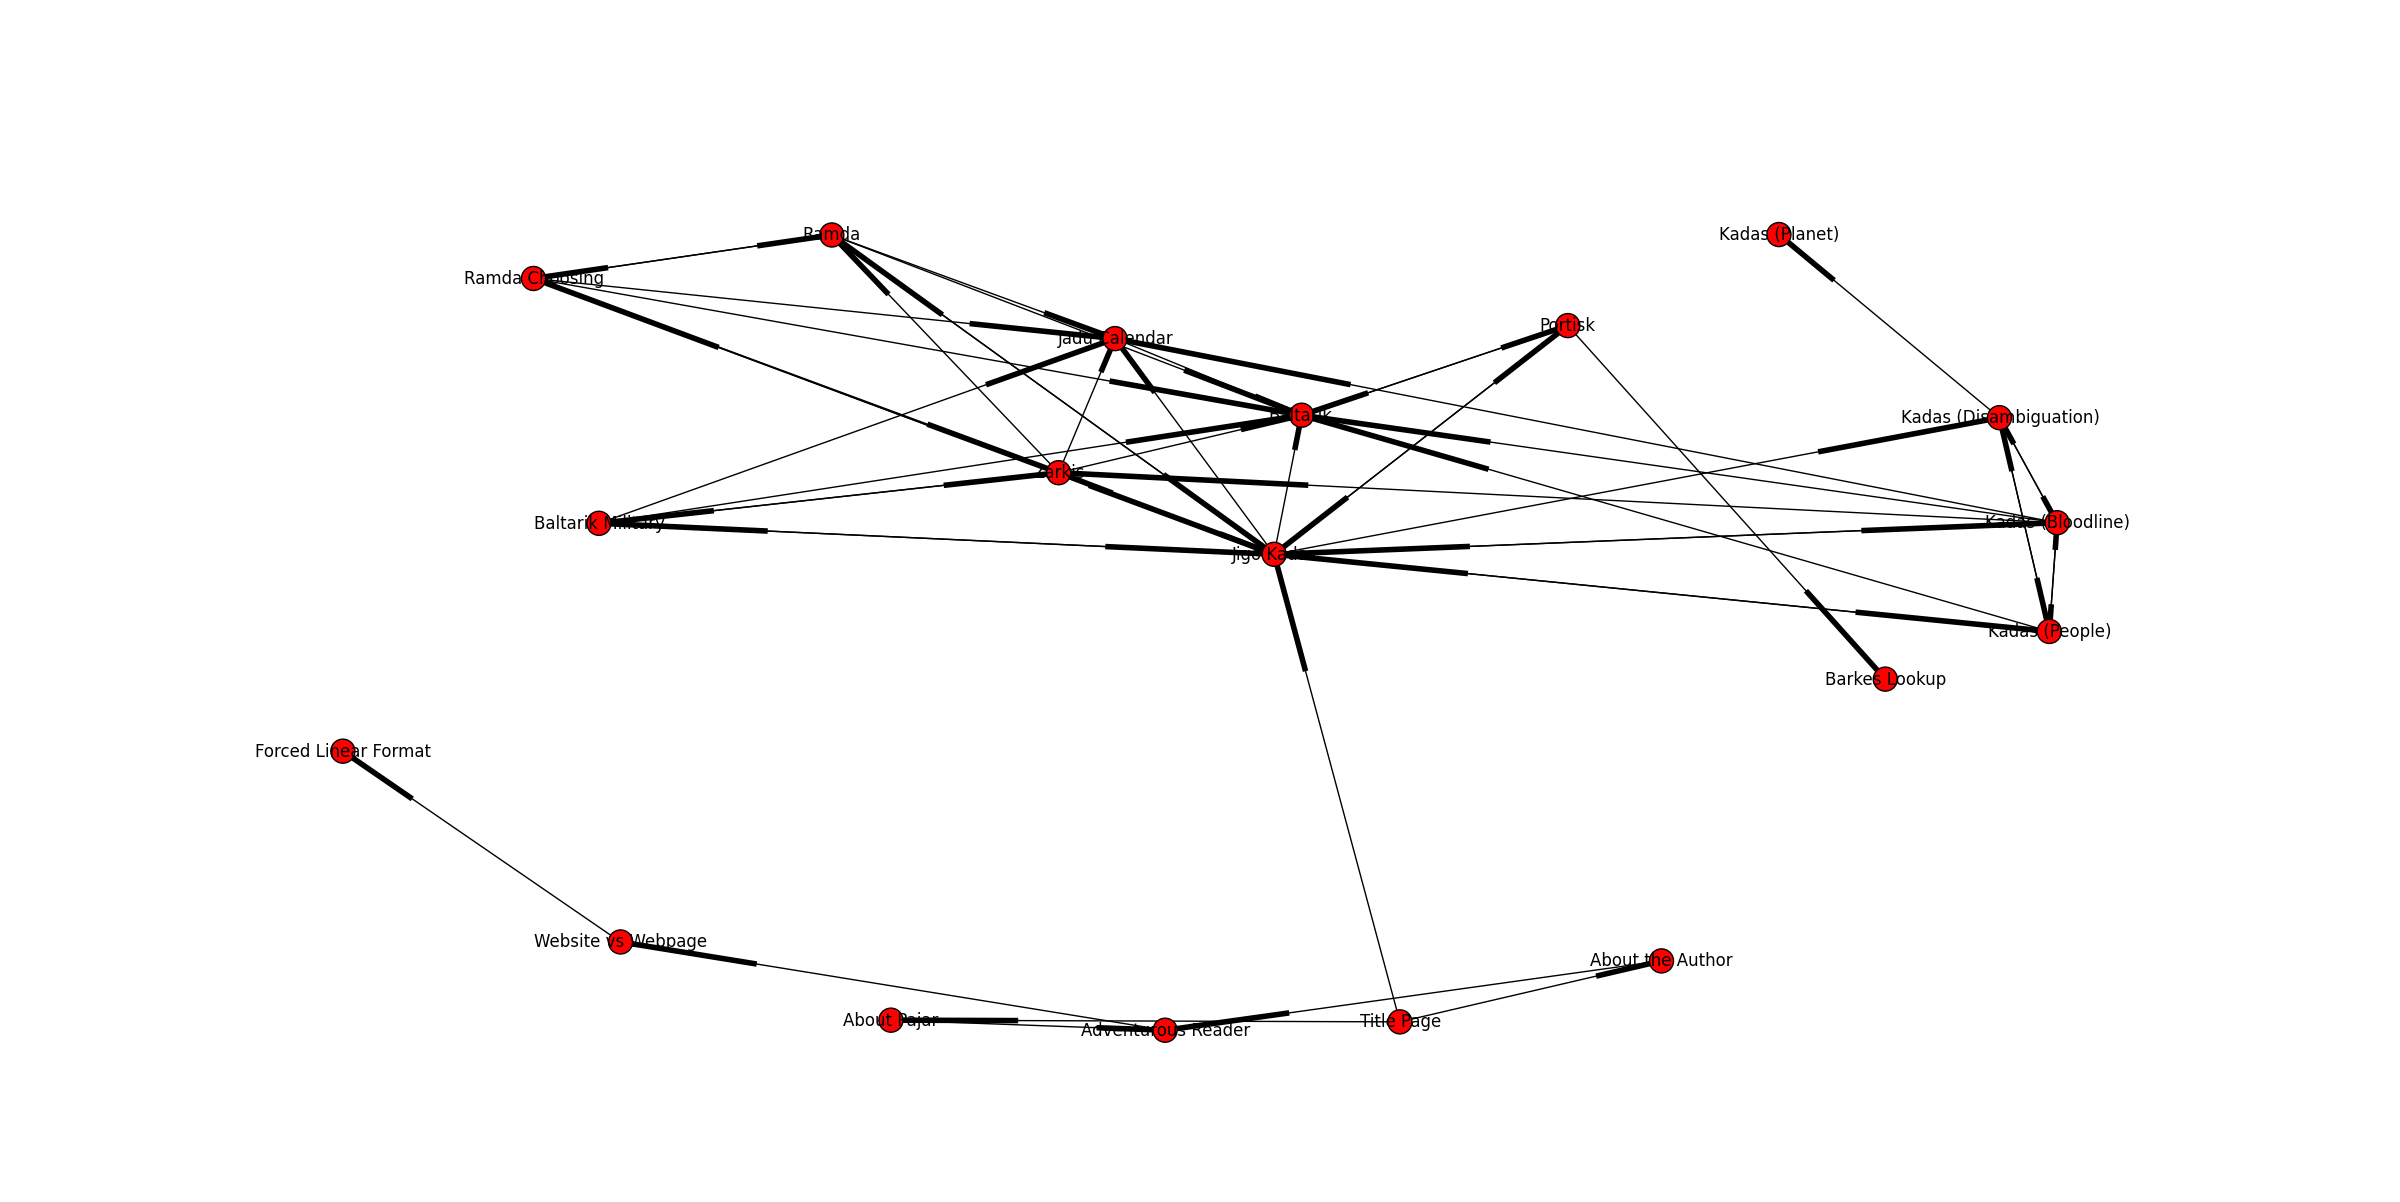
A sub-section of a non-linear novel was developed to test and demonstrate the non-linear eBook reader Adventurous Reader. The sections of this novel and how they connect together are shown in the networks below. It’s easy to see that this graph is going to get very messy, which is problematic because an interactive network will be the reader’s navigational tool as opposed to a table of contents. Considering that network visualization is a difficult problem to solve, I began research on how to better dynamically generate networks for Adventurous Reader.
Before visualizing non-linear book networks though, I needed a way to represent them. Adventurous Reader is being developed in Python, so I began by researching Python’s network/graph libraries and found networkx. This library stores networks as nested dictionary objects. Each node can store multiple attributes, including complex objects, and graphs can be directed or undirected. networkx also can write networks to files and read from files of various formats, which is important when it comes to saving the reader’s progress. It also has very basic node layout and visualization methods, but these are not powerful enough to create usable networks for complex non-linear novels.
While I will use networkx to represent the networks in code, I’ll need to look at other packages and libraries for visualization. The best options I’ve found so far are D3 and Graphviz. The problem is that D3 is a Javascript library and Graphviz is a C++ library. There is a way to use both of them in Python applications. I’ll need to determine which package will better fit my needs and then research how to integrate it.